This scale is very versatile and powerful. It offers several color palettes to choose from and automatically recognizes whether to use
a discrete or continuous scale depending on the data type of the mapping object.
It can also be used for both color and fill aesthetics by defining aesthetic accordingly directly inside the function!
Arguments
- pal
Color palette. Use either numbers from 1 to 9 or one of the names:
'arby','cute','wextor','dualtone','colorful','protanomaly','forest','hadestown','neon'- direction
Direction of the color palette. Keep blank or use 1 for the default direction or use -1 to reverse the colors.
- aesthetic
Which aesthetic to use the scale on; either
colororfill, defaults tocolor.- ...
Other common scale parameters.
Examples
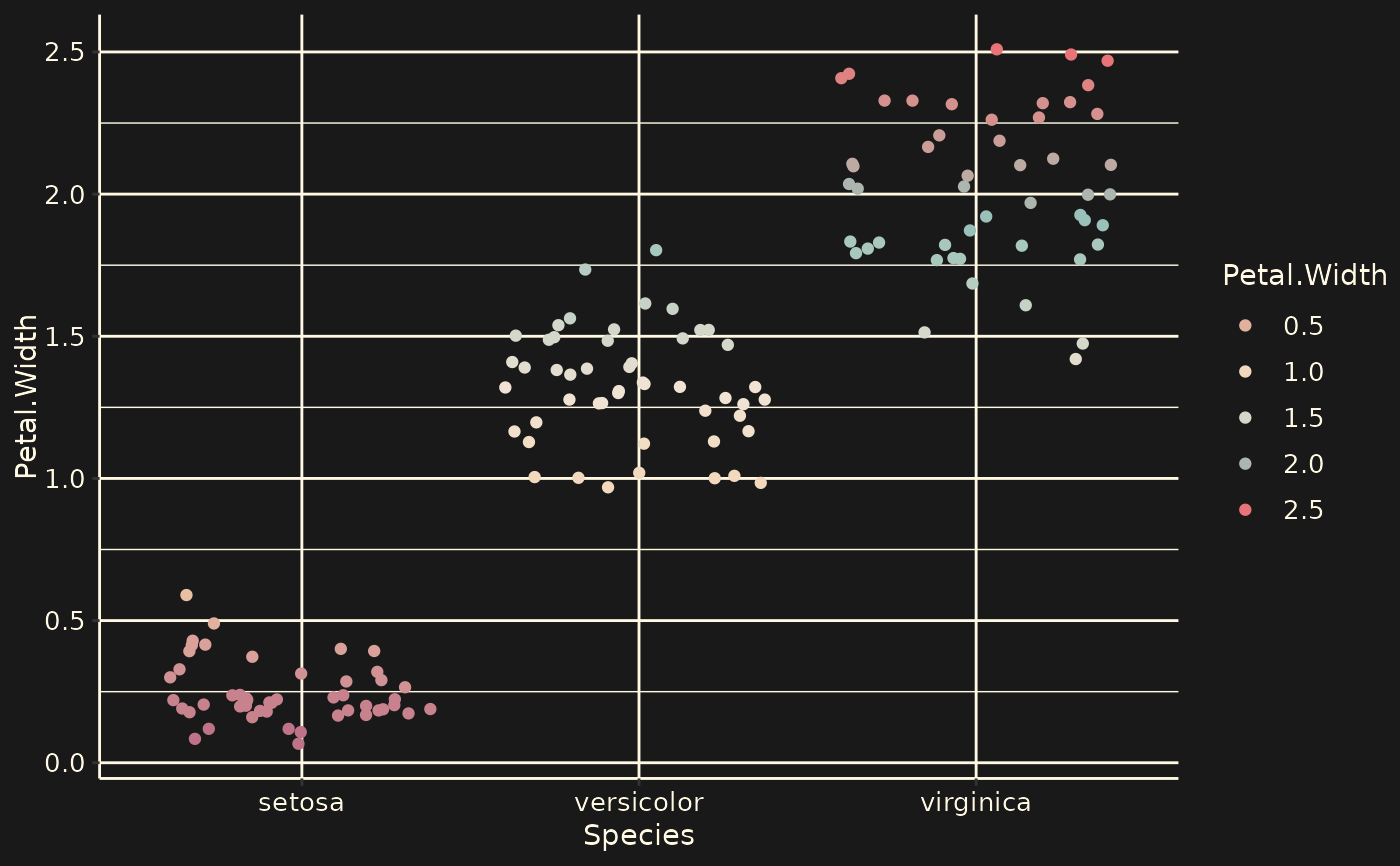
library(ggplot2)
ggplot(iris, aes(Species, Petal.Width, color = Petal.Width)) +
geom_jitter() +
theme_wob() +
scale_rextor()
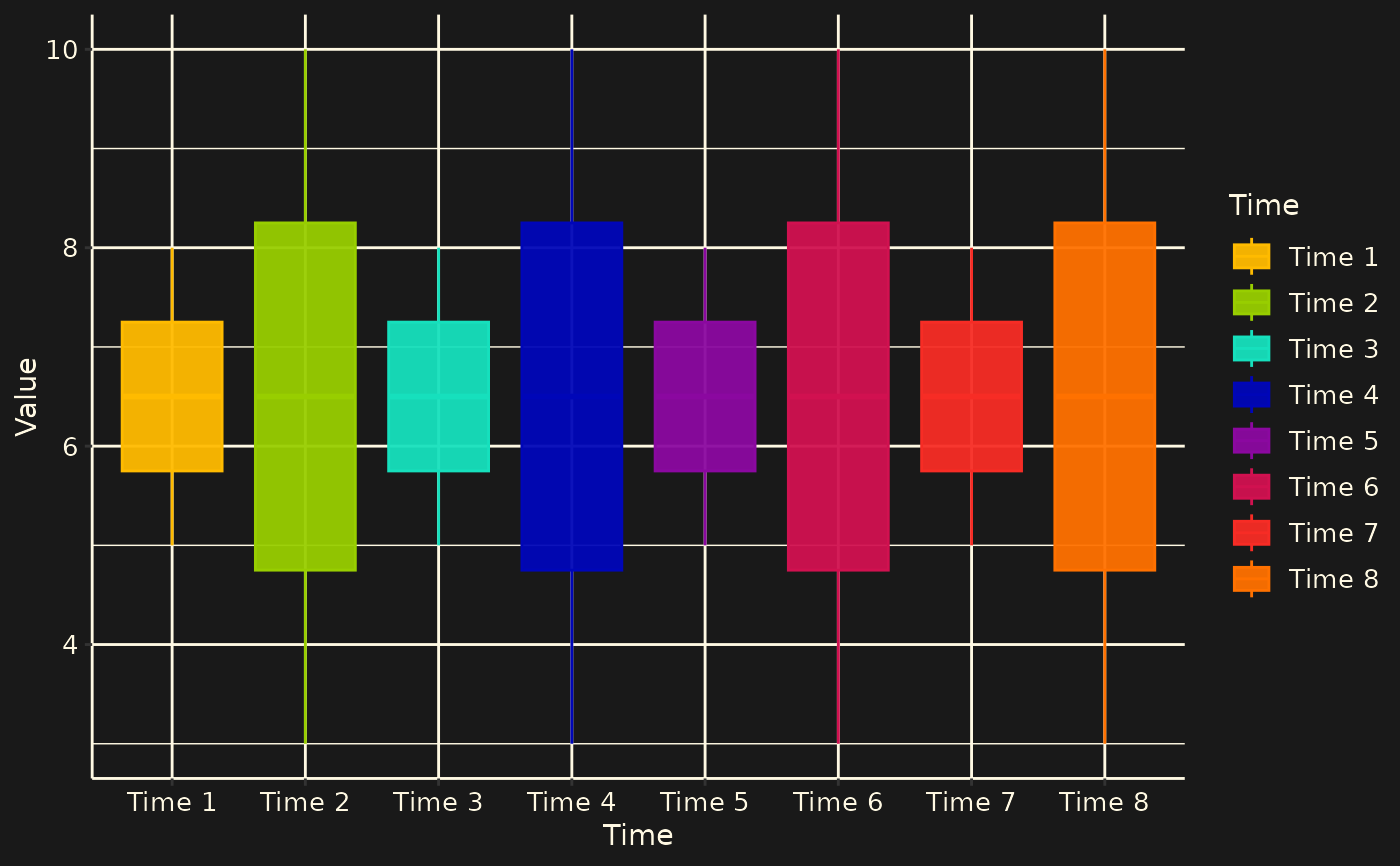
 data <- data.frame(Time = rep(c("Time 1", "Time 2", "Time 3", "Time 4",
"Time 5", "Time 6", "Time 7", "Time 8"),
each = 2),
cont = 1:16,
Value = c(8, 5, 10, 3, 8, 5, 10, 3, 8, 5, 10, 3, 8, 5, 10, 3))
ggplot(data, aes(x = Time, y = Value, color = Time, fill = Time)) +
geom_boxplot(alpha = 0.95) +
theme_wob() +
scale_rextor(pal = "neon") +
scale_rextor(pal = "neon", aesthetic = "fill")
data <- data.frame(Time = rep(c("Time 1", "Time 2", "Time 3", "Time 4",
"Time 5", "Time 6", "Time 7", "Time 8"),
each = 2),
cont = 1:16,
Value = c(8, 5, 10, 3, 8, 5, 10, 3, 8, 5, 10, 3, 8, 5, 10, 3))
ggplot(data, aes(x = Time, y = Value, color = Time, fill = Time)) +
geom_boxplot(alpha = 0.95) +
theme_wob() +
scale_rextor(pal = "neon") +
scale_rextor(pal = "neon", aesthetic = "fill")
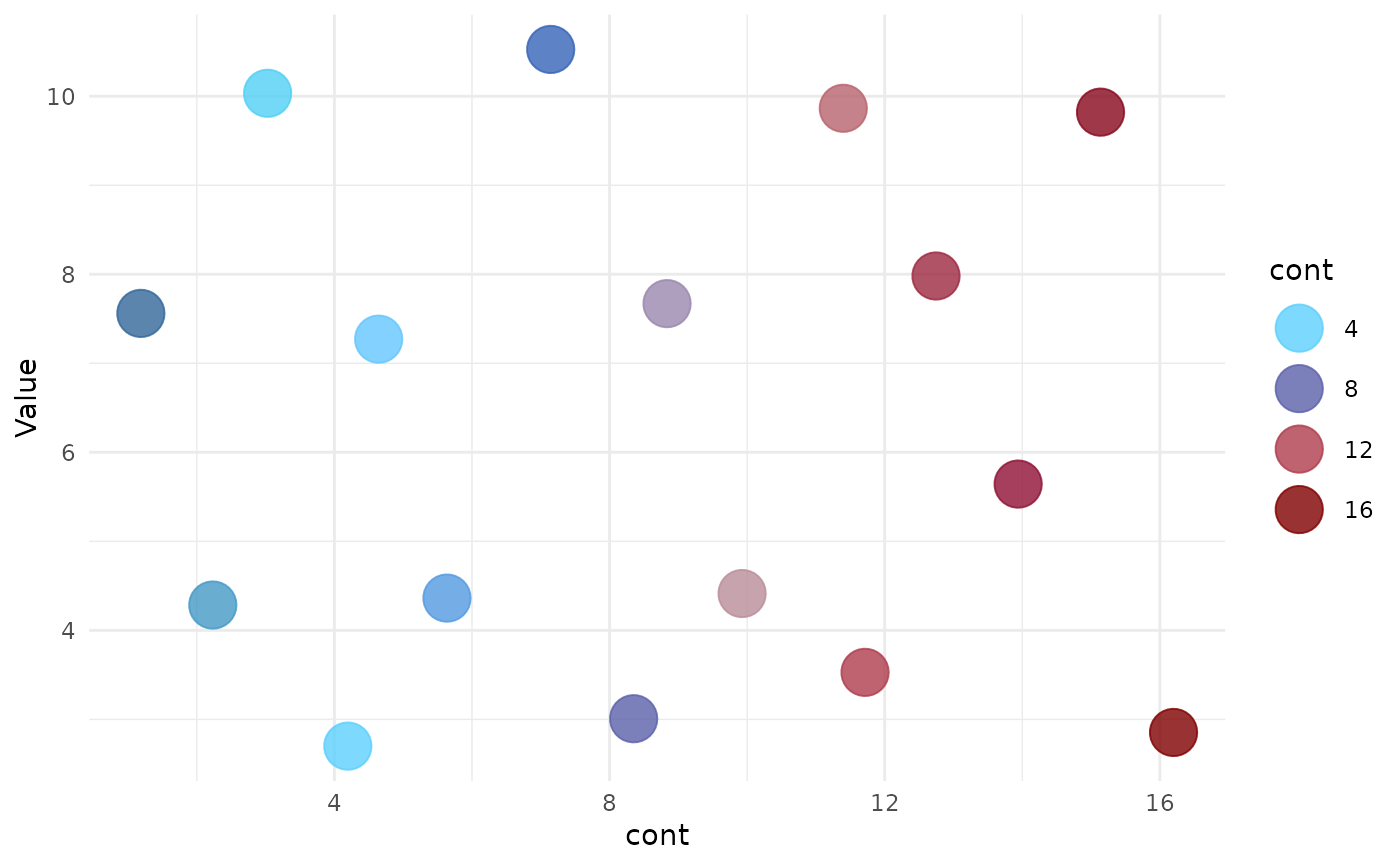
 ggplot(data, aes(x = cont, y = Value, color = cont, fill = cont)) +
geom_jitter(alpha = 0.8, size = 8) +
theme_minimal() +
scale_rextor(pal = "wextor") +
scale_rextor(pal = "wextor", aesthetic = "fill")
ggplot(data, aes(x = cont, y = Value, color = cont, fill = cont)) +
geom_jitter(alpha = 0.8, size = 8) +
theme_minimal() +
scale_rextor(pal = "wextor") +
scale_rextor(pal = "wextor", aesthetic = "fill")