Plot Most Extreme Conditions to Visualize Kolmogorov-Smirnov Test Results
Source:R/do_ks.R
plot_do_ks.RdWith this function, you can easily plot the most extreme conditions, a.k.a. those with the most
different dropout rates at a certain question. You need to define that question in the function call of
do_ks() already, or just call that function directly inside the plot function.
Usage
plot_do_ks(
  do_stats,
  ks,
  linetypes = FALSE,
  show_confbands = FALSE,
  color_palette = c("#E69F00", "#CC79A7")
)
Arguments
- do_stats
data.frame containing dropout statistics table computed by
compute_stats(). Make sure your do_stats table contains a q_idx column indexing all question-items sequentially.- ks
List of results from the
do_ks()function coding most extreme dropout conditions- linetypes
boolean Should different line types be used? Defaults to FALSE.
- show_confbands
boolean Should there be confidence bands added to the plot? Defaults to FALSE.
- color_palette
character indicating which color palette to use. Defaults to color blind friendly values, alternatively choose 'gray' or create your own palette with two colors, e.g. using R
colors()or HEX-values
Value
Returns a ggplot object containing the survival curve plot of the most extreme
dropout conditions. Using the Shiny App version of dropR, this plot can easily be downloaded in different formats.
Examples
do_stats <- compute_stats(add_dropout_idx(dropRdemo, 3:54),
by_cond = "experimental_condition",
no_of_vars = 52)
ks <- do_ks(do_stats, 52)
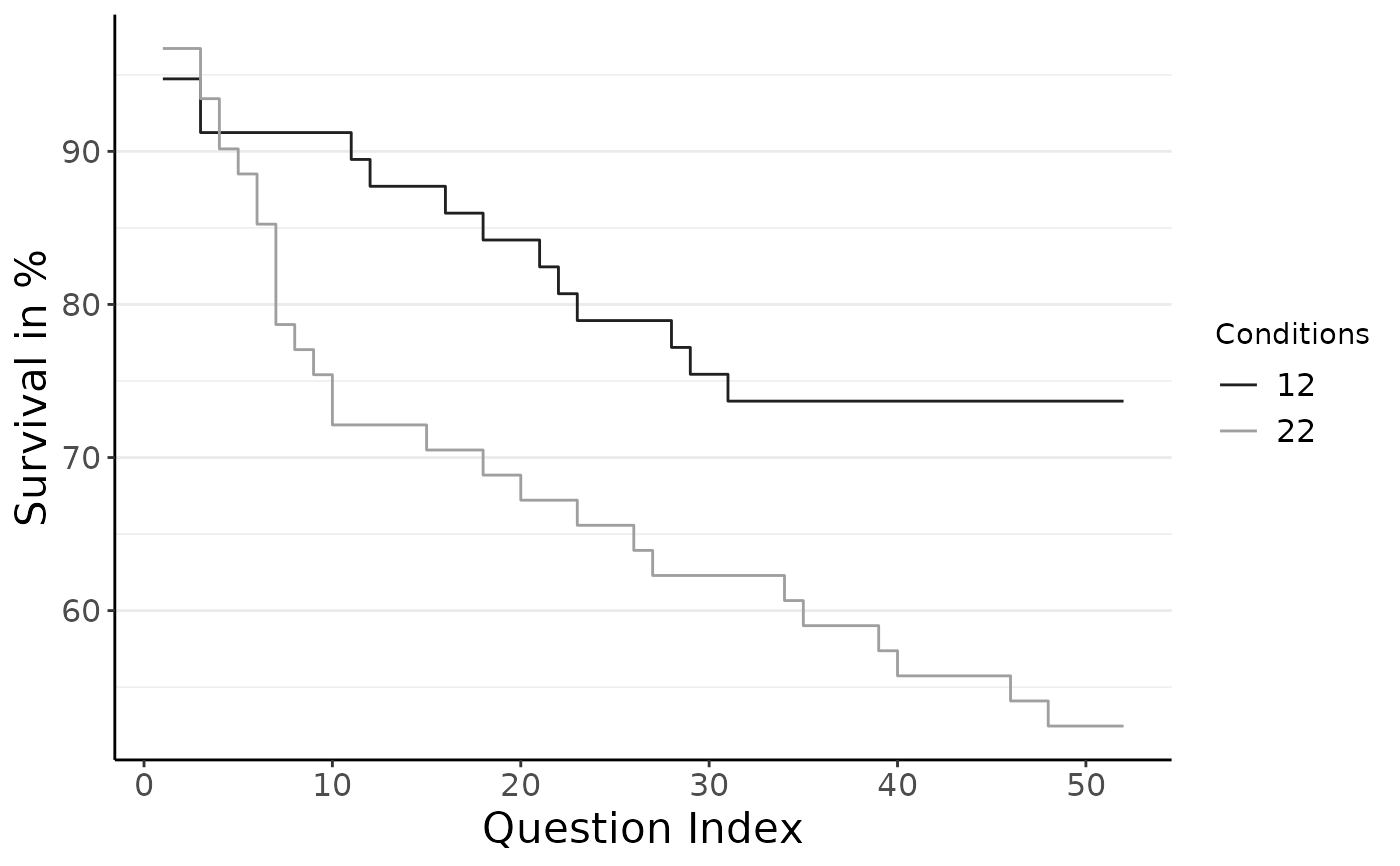
plot_do_ks(do_stats, ks, color_palette = "gray")
 # ... or call the do_ks() function directly inside the plotting function
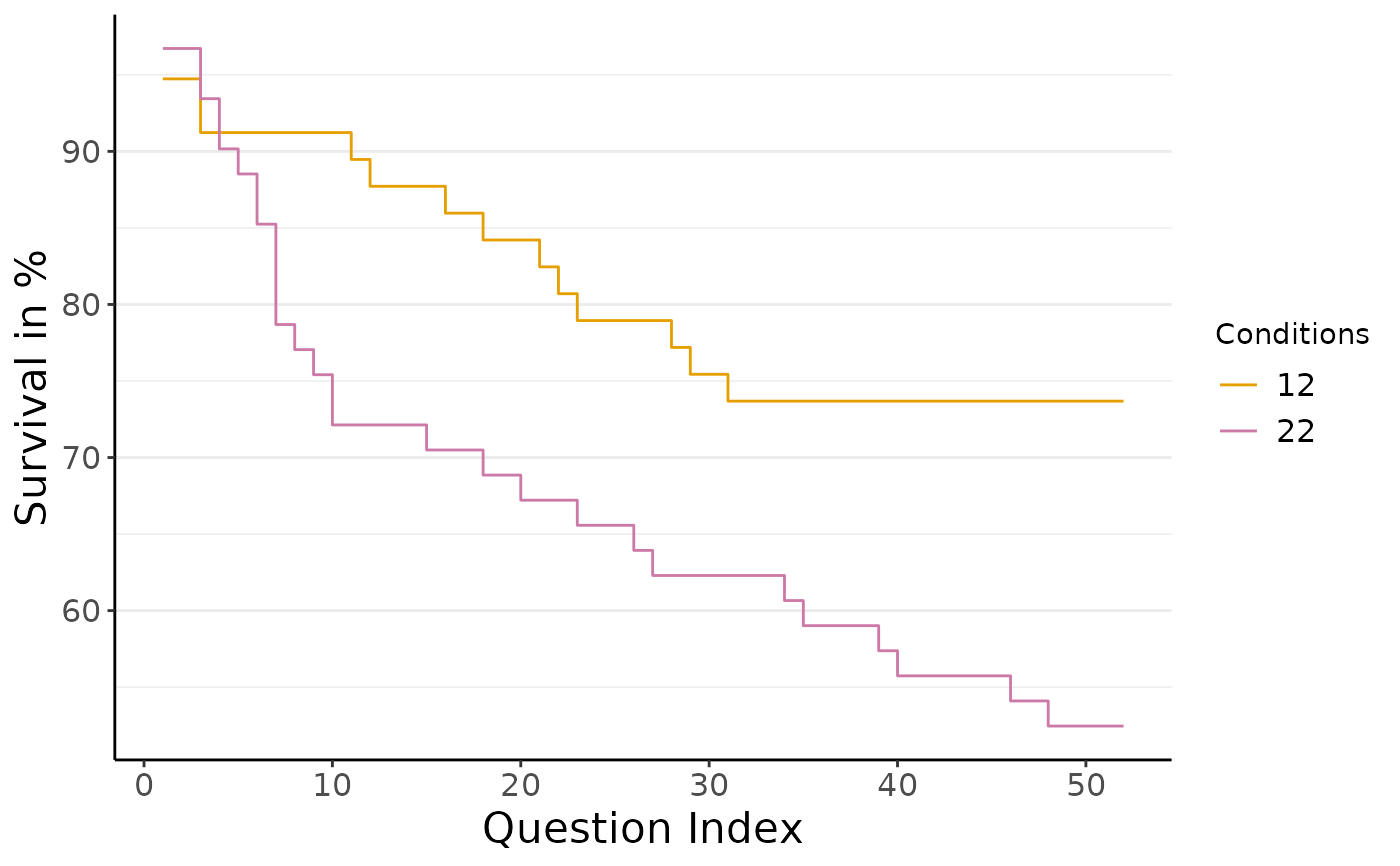
plot_do_ks(do_stats, do_ks(do_stats, 30))
# ... or call the do_ks() function directly inside the plotting function
plot_do_ks(do_stats, do_ks(do_stats, 30))
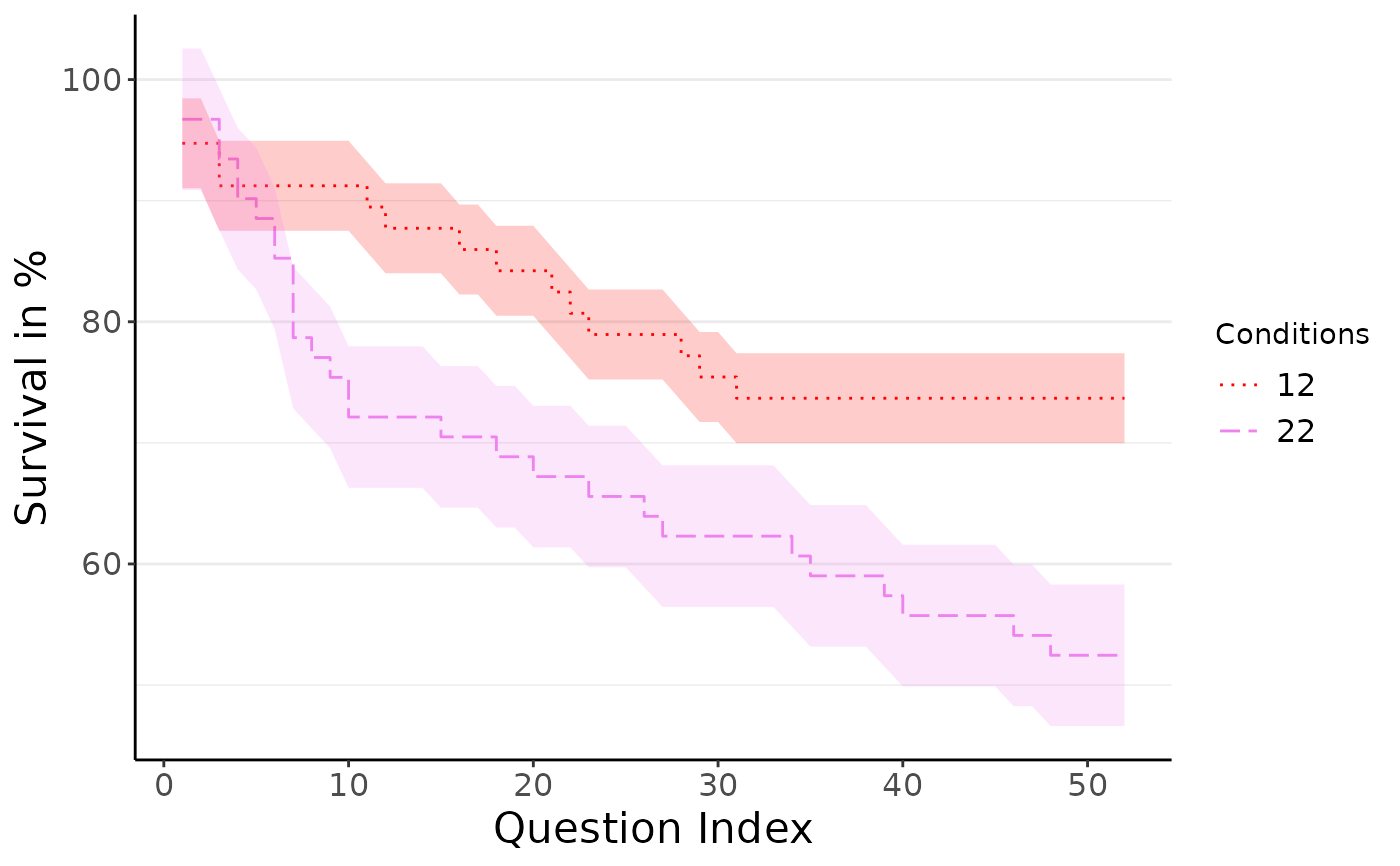
 plot_do_ks(do_stats, ks, linetypes = TRUE,
show_confbands = TRUE, color_palette = c("red", "violet"))
plot_do_ks(do_stats, ks, linetypes = TRUE,
show_confbands = TRUE, color_palette = c("red", "violet"))